Nobody publishes a reliable sector by sector price table for this corridor. The two in circulation disagree by up to two times on the same sector, and neither cites a dataset. What is verifiable is corridor level: an average around Rs 14,000 per sq ft, an active range of Rs 11,000 to Rs 16,750, and 152.3 percent over five years. This piece shows the divergence, explains how to rank sectors without a price table, and lists the five documents to pull before you commit.
Written by Mansi Joshi, Marketing Intelligence Lead, ZYN33 Investment Desk. Reviewed by Ritesh Arora, Founder, ZYN33 and Strata Capital Holdings, Gurugram. Advising on Gurugram residential capital allocation since 2023, with mandates ranging from Rs 3 Cr to Rs 50 Cr. Published 24 May 2026. Last reviewed 30 September 2026.
Disclosure: ZYN33 distributes residential projects in Gurugram and is paid a transaction fee when a purchase completes, including on projects we discuss with you. We do not give tax advice. This post is general information. Take it to your chartered accountant.
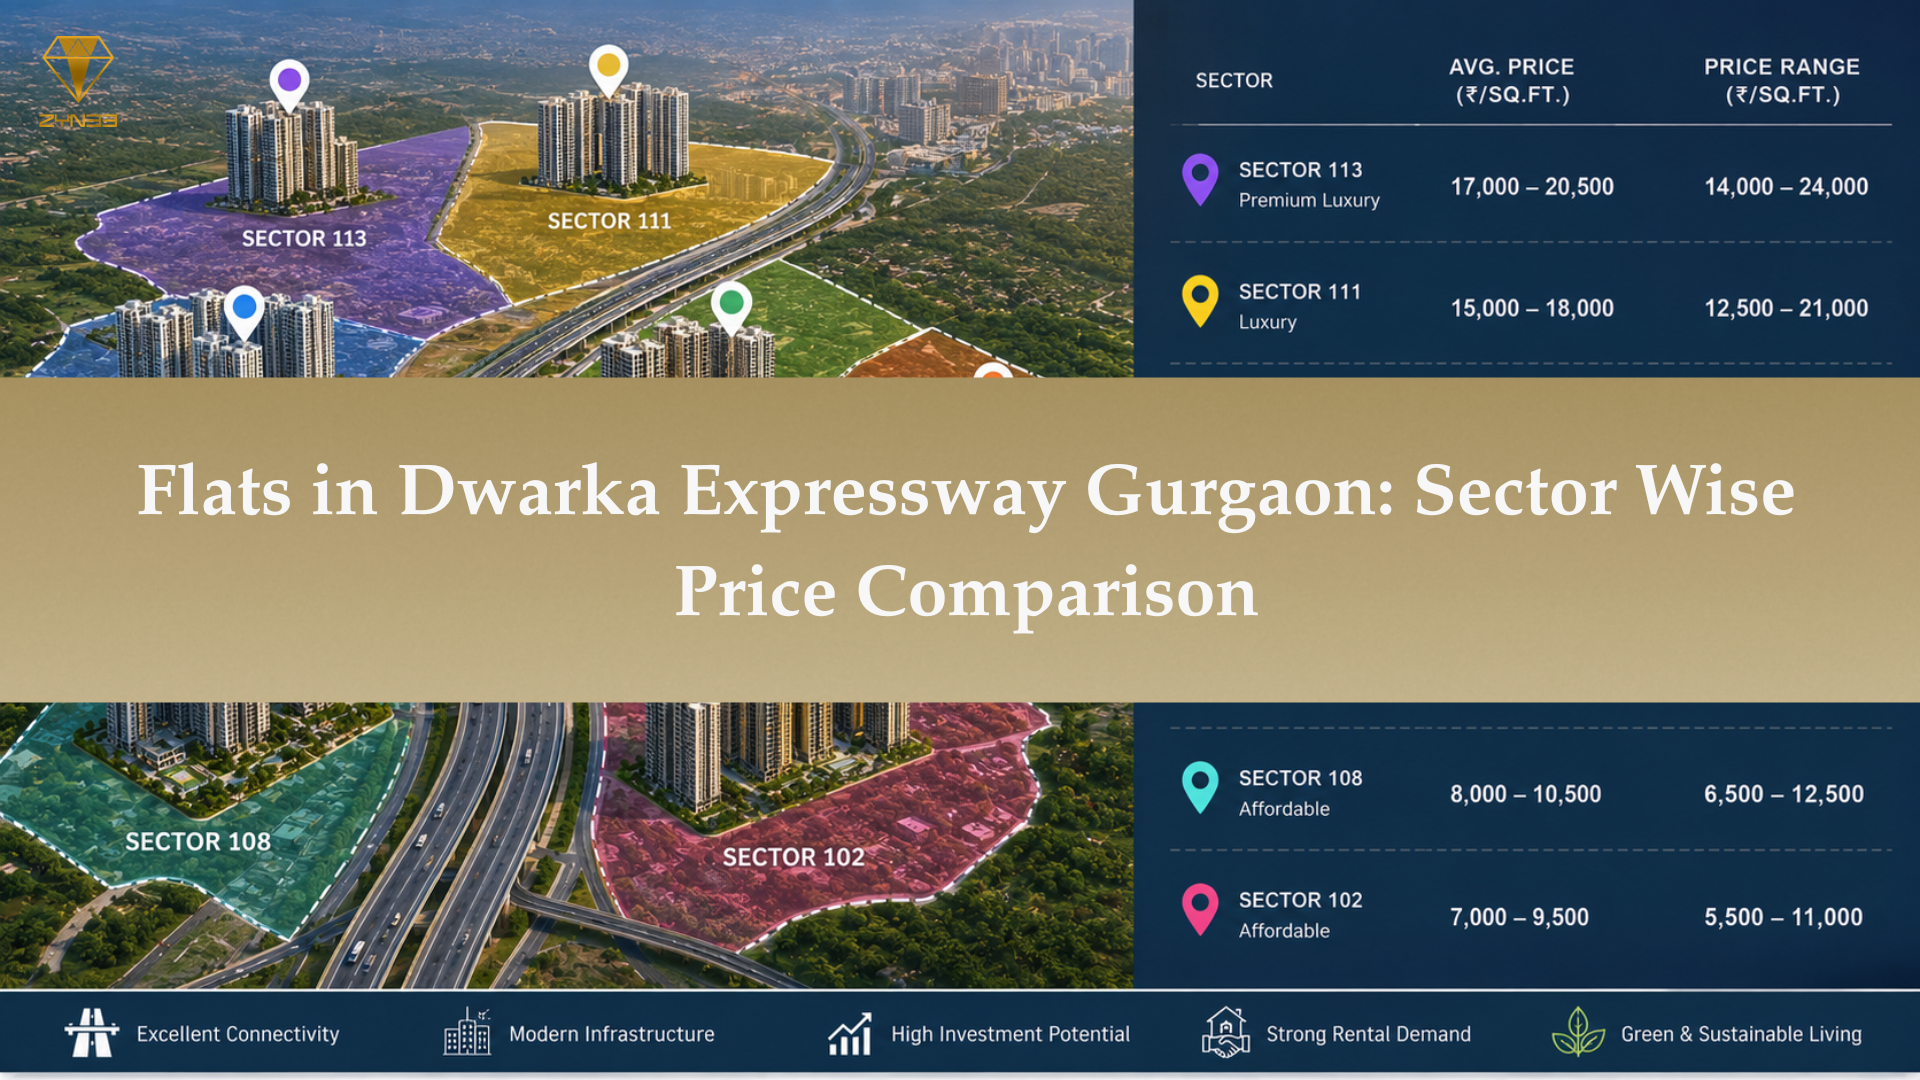
Nobody publishes a reliable sector by sector price table for this corridor. The ones in circulation disagree by up to two times, and none cites data.
That is the useful answer, not the one you wanted. What carries a source sits at corridor level. Below that, estimate is dressed as measurement. So before committing to flats in Dwarka Expressway Gurgaon, take the corridor numbers and see how far the sector tables diverge.
|
Your situation |
What to do |
|
Comparing two sectors on quoted rates |
Stop. Pull registered transactions instead |
|
Holding 4 to 6 years |
The corridor figure is enough to size the decision |
|
Told one sector is 20 percent below another |
Ask which two projects, and for launch rates in writing |
|
Exit inside 24 months |
Do not enter. Costs run 9 to 13 percent of value |
If none is you, stop here.
Four figures, all corridor level, all from 99acres. The average sits near Rs 14,000 per square foot, in an active range of Rs 11,000 to Rs 16,750. Rates moved 12 percent over twelve months and 152.3 percent over five. Supply runs past 7,600 listings.
That five year figure is the strongest in Gurugram, against 96.5 percent for Golf Course Road. Dwarka Expressway Phase 2 prices is the reason.
Note what it excludes. A ceiling of Rs 16,750 leaves no room for the Rs 26,000 branded numbers quoted as Dwarka Expressway flat prices. It leaves none for Rs 8,000 entries.
|
Sector |
One published table |
Another published table |
|
103 and 104 |
Rs 15,500 to Rs 26,000 |
Rs 12,000 to Rs 18,000 |
|
102 and 106 |
Rs 11,000 to Rs 17,000 |
Rs 9,000 to Rs 13,000 |
|
109 |
Rs 14,000 to Rs 19,000 |
Rs 6,500 to Rs 9,000 |
Sector 109 is the one to sit with, at more than double in one table. Both are published as current, neither names a source, and the second calls its figures its own.
So sector wise price Dwarka Expressway tables are not measurements. They are opinions with decimal points, and they move budgets by crores.
Apply cycle positioning at corridor level, where data exists. Infrastructure arrived first and prices followed hardest, which 152.3 percent records.
A corridor that has repriced is a different proposition from one still repricing. SPR printed 18.4 percent over twelve months against this corridor's 12.0. Most of the gain here is behind you.
You can rank them without pricing them, on three things you verify rather than read off a table.
Supply still to complete comes first. Count the registered projects in your sector and their filed possession dates. Heavy supply completing together holds pricing back while it absorbs. No source publishes this by sector, so count it from HRERA filings.
Then delivery. A sector with operational projects and lived in social infrastructure prices differently from one holding launches only.
Then distance to something delivered rather than announced. The Haryana carriageway opened in March 2024, the Delhi section in August 2025. The airport tunnel and the metro have not. An uplift priced off either is priced off a projection.
Not on this corridor's core. The sanctioned line runs 28.5 km from Millennium City Centre to Cyber City with 27 stations, serving Old Gurugram, Palam Vihar and Udyog Vihar.
Dwarka Expressway touches it through one spur station at Sector 101. Phase 2 entered tendering in early 2026 and was not awarded, with operations reported as late 2027 or 2028. Indian infrastructure routinely runs 12 to 24 months behind projection.
Under 3 percent. Golf Course Road prints 3.0 and is joint highest in Gurugram on 99acres data, so every other corridor sits beneath it. New Gurgaon prints 2.6.
Anarock puts the city aggregate at 4.3 percent, up from 3.5. That is a basket across every segment, not a corridor figure. Sector yields of 4 to 5 percent circulate here, and no source supports them.
Illustrative, not guaranteed. Both cases enter at the corridor average, the only sourced rate.
The buyer who entered at the corridor average. Rs 2.5 Cr compounding at 8 to 10 percent a year, below the twelve month print. That reaches Rs 3.67 to Rs 4.03 Cr in five years. Add a 2.5 percent yield and the nominal blend runs 10.5 to 12.5 percent.
The projection that could not pay for itself. Sector pages here routinely quote an IRR their own price path cannot produce. Rs 2.475 Cr to Rs 4.05 Cr over six years is 8.6 percent a year. Printed beside it sits a net IRR of 13 to 16 percent. That needs rent to contribute 4.4 to 7.4 points net, on a gross yield under 3 before tax, maintenance and vacancy.
|
Profile |
Budget |
Hold |
Action |
|
First purchase on the corridor |
Rs 1.5 to Rs 2.5 Cr |
6 years plus |
Lower supply density, delivered social infrastructure |
|
Balanced |
Rs 2.5 to Rs 4 Cr |
4 to 6 years |
Operational projects with three achieved rents you can see |
|
End use, airport driven |
Rs 4 Cr plus |
7 years plus |
Pay for the address knowingly, not for a metro date |
|
Yield led |
Any |
Any |
Wrong corridor. Everything sits under 3 percent |
Three buyers should leave flats in Dwarka Expressway Gurgaon alone. Anyone budgeting from a band read online, given Sector 109 at Rs 6,500 in one table and Rs 19,000 in another. Anyone pricing in a metro station. Anyone exiting inside 24 months, where costs of 9 to 13 percent eat it.
What matters is anything transacted or filed. Registered transactions in your sector this year. The nearest comparable's launch rate, in writing. Achieved rents on three units in the building. Supply still to complete, counted from filings. And whether a projection's headline matches its own price path, which here it often does not.
Noise is anything merely asserted. A band with no source. A discount to another sector, quoted without naming the two projects. A yield of 4 to 5 percent where the city's best corridor prints 3.0. A net IRR beside a slower price path. Corridor averages, which say where the corridor has been, not what your flat does.
Four things. Registered transaction data at sector grain. Phase 2 awarded. The airport tunnel reaching a contractor. And absorption turning up, since Gurugram holds roughly 46 percent of the NCR's unsold homes with launches down 48 percent quarter on quarter.
Five documents, none a price table. Registered transactions for your sector over six months, the only real price signal. The nearest comparable's launch rate, in writing. Three achieved rents. The collector rate. Then the registration and filed possession date.
That last one outweighs any price per sq ft Dwarka Expressway quote, and RERA Haryana benefits sets out why.
Anchoring is the first risk. Budget from a band two thousand rupees a foot too low and every real quote looks overpriced. Too high and you overpay.
Supply is the second. Where several towers in one sector complete together, secondary pricing tends to stay flat until that stock absorbs. How long depends on the count, which is why filings matter more than bands.
Paying for a gain already taken is the third. 152.3 percent is behind you, which is what undervalued property in Gurgaon turns on.
On price, when your sector trades level with its stronger neighbour: the gap has closed. On event, the Phase 2 award and the tunnel contractor. On time, possession plus 18 to 24 months, once rental benchmarks exist.
So choose on supply, delivered infrastructure and projects you can walk through. Then price from registered transactions. Anyone ranking best sectors Dwarka Expressway to the nearest five hundred rupees a foot is selling certainty that does not exist. Hold the Dwarka Expressway price trends view instead.
Strata Capital Holdings tracks price band shifts, infrastructure timelines and inventory movement across Gurugram's corridors. ZYN33 brings that into every allocation conversation.
99acres corridor data, retrieved 16 September 2026. Average around Rs 14,000 per sq ft, active range Rs 11,000 to Rs 16,750, over 7,600 listings, up 12.0 percent over twelve months, 75 percent over three years, 152.3 percent over five. Golf Course Road Rs 27,800 per sq ft, up 96.5 percent over five years, yield 3.0 percent and joint highest in the city. New Gurgaon yield 2.6 percent.
Dwarka Expressway price trends, 27 December 2025. Sectors 103 and 104 at Rs 12,000 to Rs 18,000, Sectors 102 and 106 at Rs 9,000 to Rs 13,000, Sectors 109 and 112 at Rs 6,500 to Rs 9,000. The page states these are its own assessment.
Square Yards via The Realty Today, 23 June 2026. SPR up 18.4 percent year on year.
Gurugram Metro status, 13 July 2026. Sanctioned 28.5 km, 27 stations, the Basai spur to Sector 101, Phase 2 tendered and not awarded.
Anarock via Business Today, 4 August 2026. Gurugram yield 3.5 to 4.3 percent, a city aggregate.
Anarock, NCR Viewpoints Q2 2026. Roughly 46 percent of NCR unsold stock, launches down 48 percent quarter on quarter.
The two named cases are composite illustrations, not clients. No source publishes sector level bands for this corridor with data behind them.
2 BHK vs 3 BHK Dwarka Expressway
Dwarka Expressway vs SPR
Golf Course Extension Road
New Gurgaon property market
Southern Peripheral Road Gurgaon
Rental yield Gurgaon 2026
Disclaimer
This article is general information about tax and property mechanics in India. It is not tax advice, investment advice or a recommendation to buy a specific property, and it does not account for your personal circumstances. Rates, thresholds and deadlines change. Verify every figure against the source listed above and take your liquidation plan to a qualified chartered accountant before you sell anything. ZYN33 distributes residential projects in Gurugram and is paid a transaction fee when a purchase completes. We do not act as your tax adviser or your adviser on the equity side.
Tell us your budget and timeline.
Tell us your budget and timeline.